Deep learning-based cancer patient stratification
Cancer is a major public health and economic issue and its burden is ever increasing. Only in the US, it accounts for $90 Billion in direct medical costs. It costs $2.7 Billion to develop a cancer drug. About 9.5 million people die of cancer every year. This is higher than the population of some of the biggest cities in the world. Our Arcas project aims to improve this situation by employing state-of-the-art data integration and analysis methods on top of decades worth of genomics know-how.
Why is cancer burden so high?
Developing drugs and getting them to patients is a long and time consuming process. First, a compound that needs to get to patients, has to go through pre-clinical research and different phases of clinical trials. Next comes the approval process, and finally doctors have to prescribe and believe that it could help the patient. Sometimes such drugs need to be listed in the guidelines in order to be prescribed - even if they are approved. It’s safe to say that there are many inefficiencies in each step of this process.

Figure 1: Drug development process and the use of genomics data
The most recurring or impactful reason for these inefficiencies is an overly simplistic and narrowly focused approach in different parts of the process chain. Here is an example: we say cancer is a disease of the genome, however, cancer patients rarely get their genome sequenced, and interpreted. When they do, only a couple of hundred genes are sequenced. Information, such as imaging, and histopathological staging etc. is useful, but provides a limited picture of the disease. As a result, if you do not take the whole genome into account, a lot of information goes missing. This is the case for therapeutic decisions, and also in drug development.
It is now clear that response to therapy, especially for targeted drugs, is strongly dependent on cancer's genetic, epigenetic, transcriptomic makeup of the tumor, as well as tumor microenvironment (Example: WINTHER Trial). All of these vary substantially between different cancers, even from the same tissue. So, drug responses must be evaluated in relation to a cancer's genotype/epigenotype/transcriptome. Moreover, many drugs will fail simply because they are effective only on a subset of cancers, which was not initially recognized at the time of the trial.
“Many drugs will fail simply because they are effective only on a subset of cancers, which was not initially recognized at the time of the trial”
Multi-omics patterns for clinical variable modelling
One way to eliminate these problems is to accept that clinical variables, such as drug response, are driven by genome/transcriptome/epigenome patterns and not just by mutations of single genes. Once we accept that, we have to have efficient methods for analyzing multilevel data sets, such as multi-omics, from cancer biopsies or tumor models. Efficient integration of multi-omics data will provide an assumption-free or assumption-sparse, data-driven and integrative approach for modelling clinical variables.
“an assumption-free or assumption-sparse, data-driven and integrative approach for modelling clinical variables.”
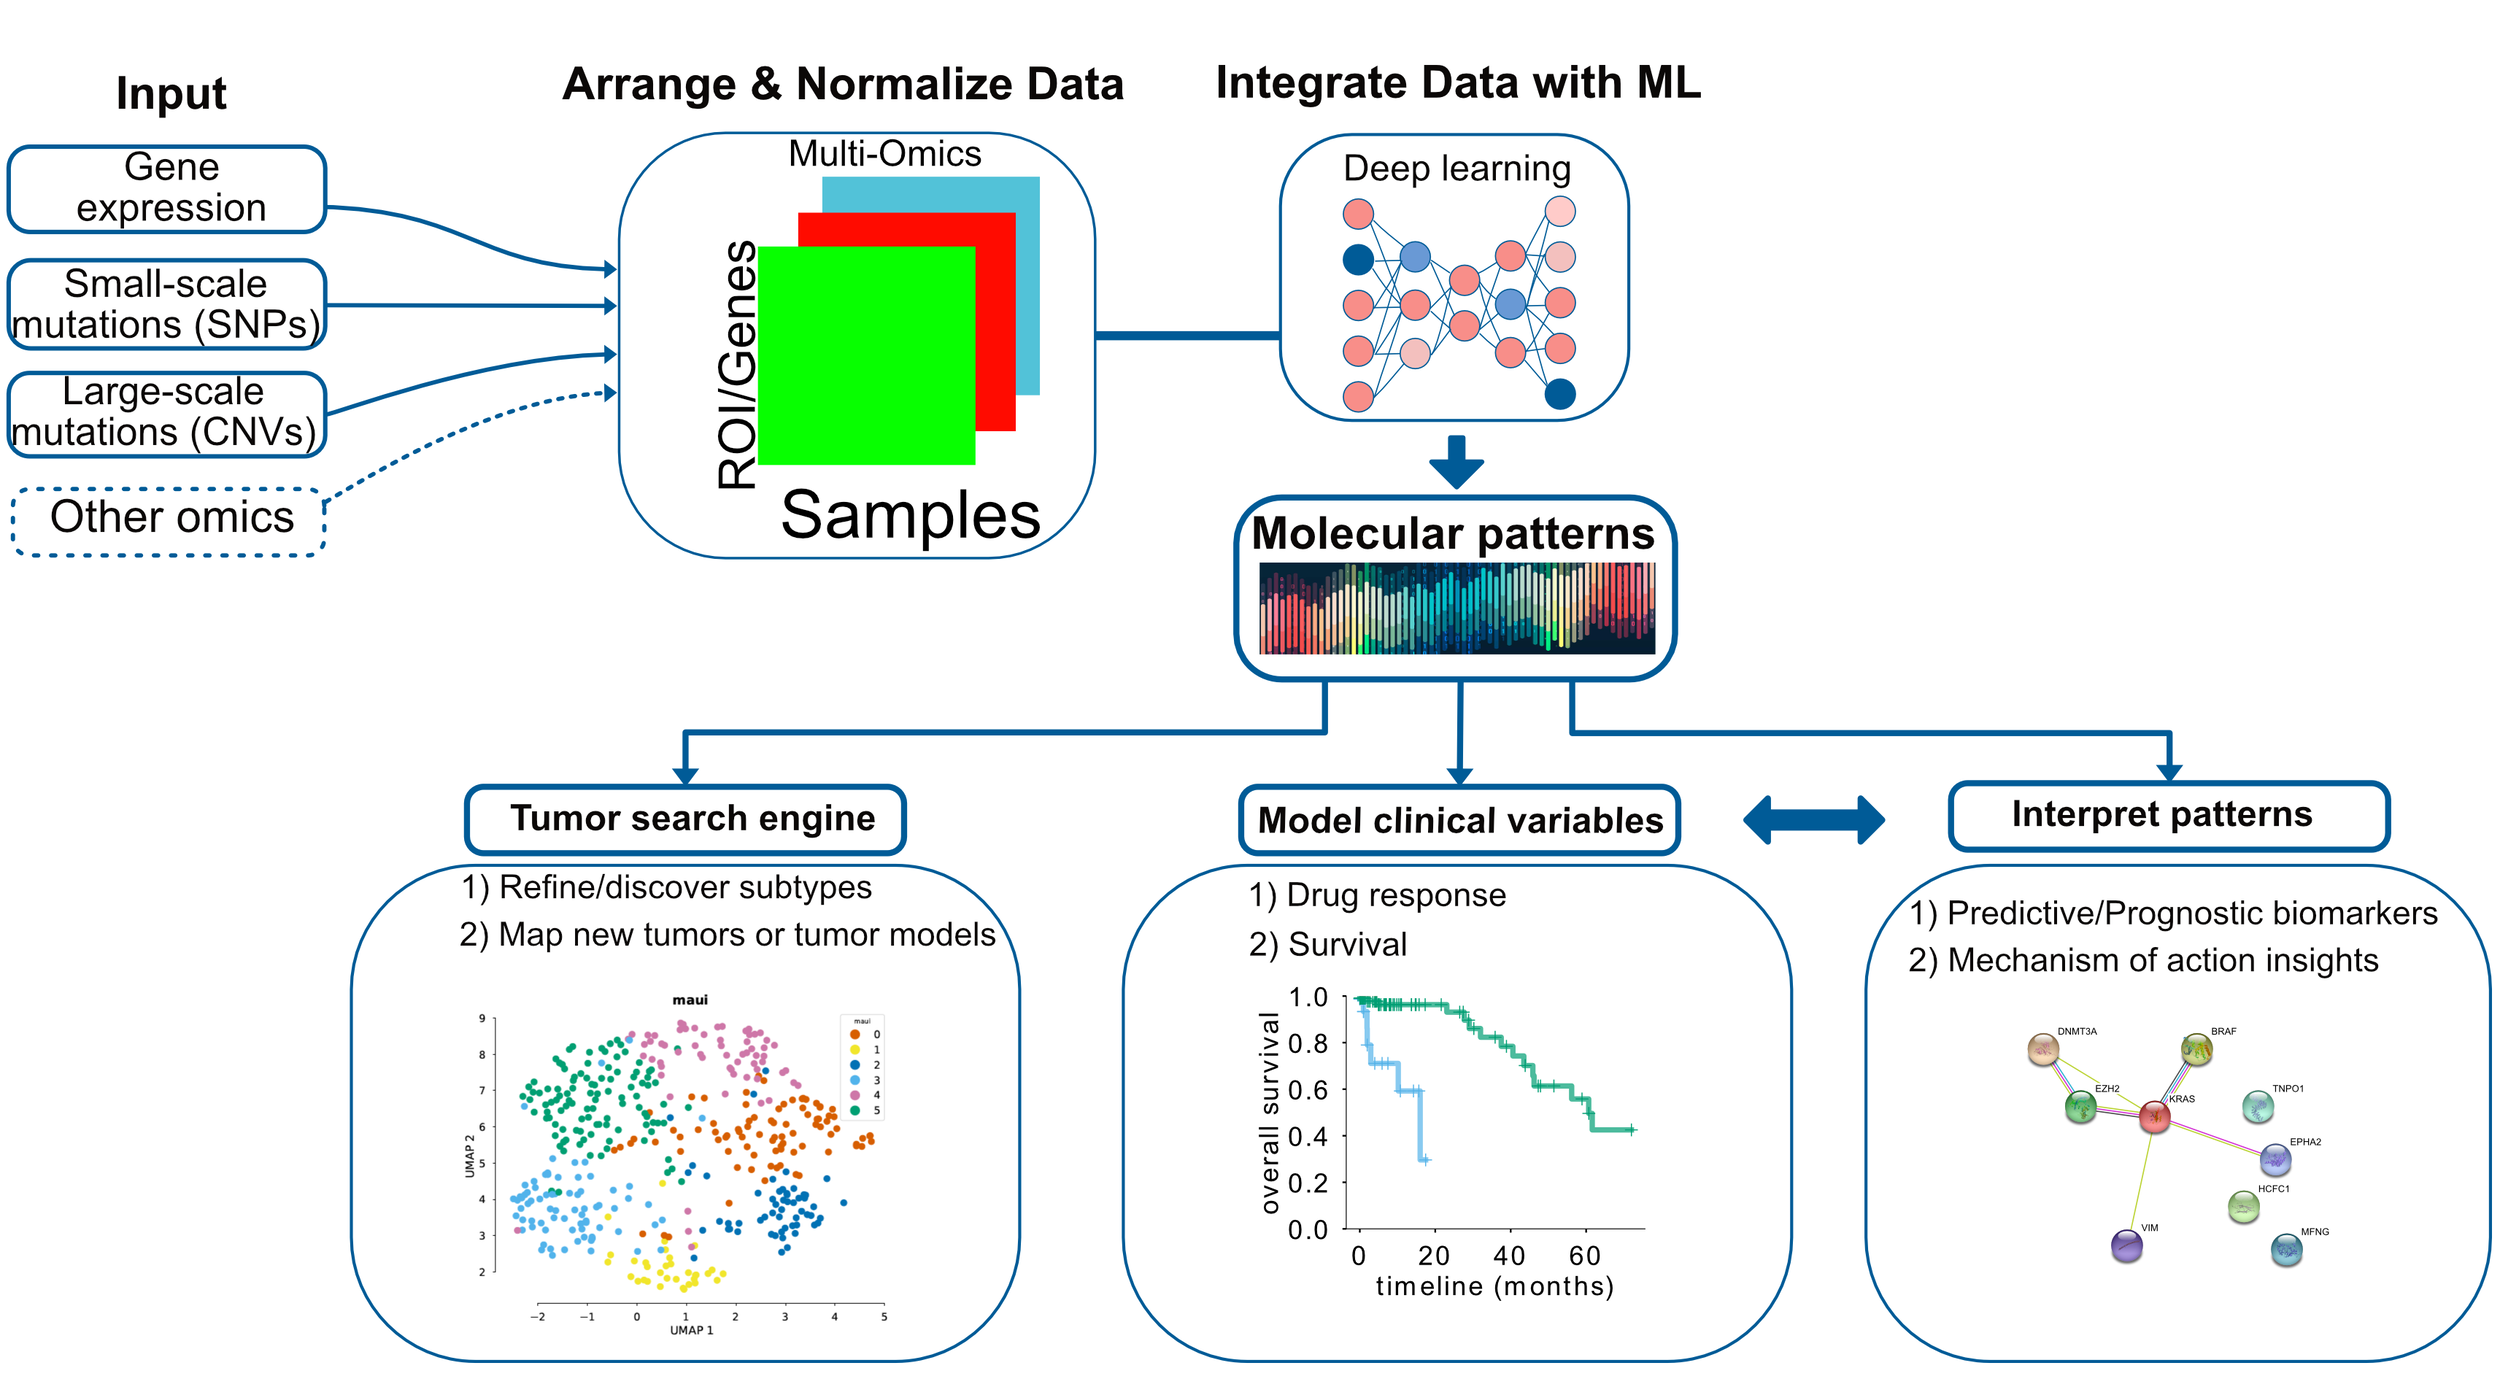
Figure 2: Data integration for cancer omics can deliver molecular patterns predictive of clinical variables.
At Arcas, we have developed such a framework which uses deep learning to integrate any kind of omics data and discover molecular patterns, or so-called latent factors. Latent factors can be used for 1) clustering/subtype detection or mapping disease models and primary tumors - analogous to a biological search engine. Imagine you can input multi-omics data for your disease models and we can tell you which primary cancers are best represented by those models. In addition, 2) we can model variables such as survival and drug response. Furthermore, 3) we can also interpret the latent factors, and understand which molecular mechanisms, or pathways they correspond to.
Patient stratification using deep learning
Molecular patterns or latent factors can stratify patients based on prognosis or response to drugs, or any other clinical variable. We have applied part of Arcas technology on colorectal cancers. Colorectal cancers have four subtypes defined using mainly gene expression profiles. These subtypes are known as consensus molecular subtypes or CMS. The consortium defined four subtypes that have different molecular characteristics that correlate with survival to some degree, however 19% of the patients could not be assigned to a particular subtype.
Can we predict subtypes using latent factors?
If these molecular patterns, i.e. latent factors, contain relevant information, we should be able to predict the CMS from them. Here we are looking at a receiver operating characteristic curve, or ROC curve, which shows how good a classifier is. In our case, the ROC curve shows that latent factors are able to predict CMS subtypes. We compare our method with other methods that also produce latent factors or the related principal components. In all cases, our prediction accuracy is higher.
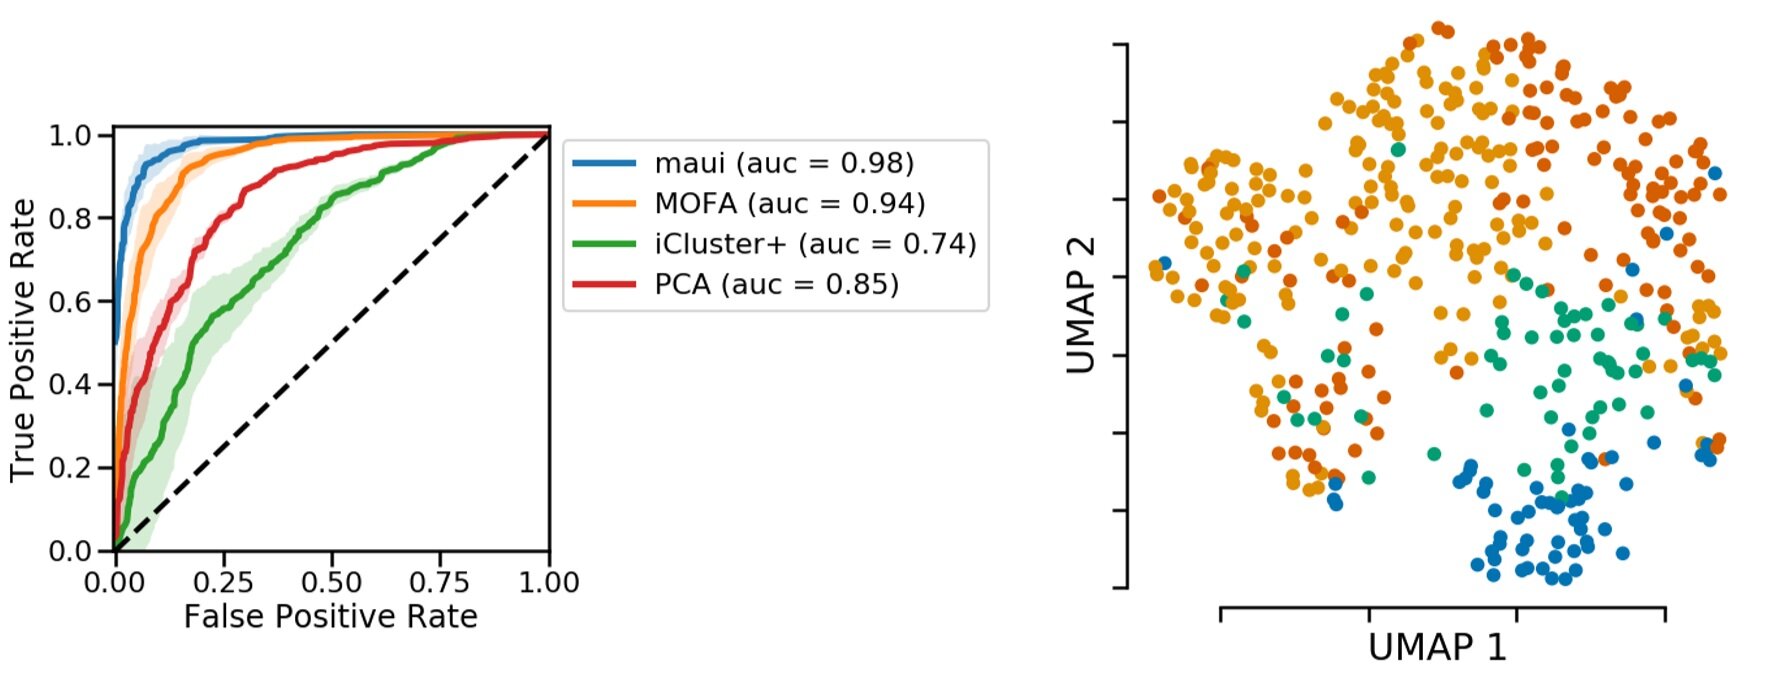
Figure 3: Predicting subtypes using latent factors obtained via deep learning is more accurate. Left, accuracy in comparison to other toos. Right, Representation of colorectal tumors by reducing latent factors to 2D. The plot obtained from https://pubmed.ncbi.nlm.nih.gov/31792061/.
On the right, we color-coded the 2D projection of latent factors based on the CMS status. Each dot is a primary tumor colored by the CMS status. You can see separation of colors, which means there is information in latent factors about CMS status.
Refining subtypes
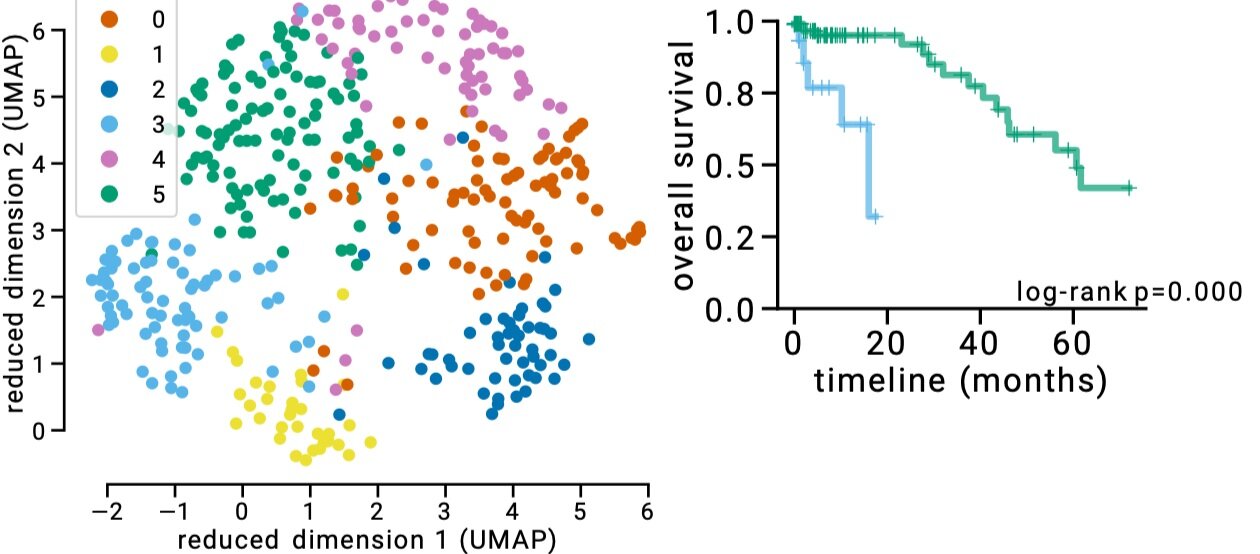
Figure 4: Refined subtypes for colorectal cancer. Green and Blue dots represents CMS2 subtype, however separating this subtype into 2 subtypes as suggested by latent factor clustering makes more sense in terms of different survival characteristics of these two groups. The plot obtained from https://pubmed.ncbi.nlm.nih.gov/31792061/
We can further refine the subtypes using this technology. You might have noticed that there are more clusters than the colors based on CMS in Figure 3. If we apply a clustering algorithm, we can find six clusters. The biggest difference is that we separate CMS2 into two clusters. In terms of survival, this actually makes a lot of sense. In Figure 4, we show survival curves of these new two clusters, which are very different. It could be, therefore, justified to break-up CMS2 to two subtypes.
Works on other cancers too
One of the things we should emphasize is that this method is not limited to a specific cancer type. It works in any data set that has multi-omics information, including tumor models, such as cell lines, PDX or organoids. In fact you can integrate cell lines, PDX, and primary tumors using our method -something that is hard to do normally.

Figure 5: Arcas platform improves survival prediction over using clinical features.
We have run this on the cancer genome atlas data sets that have at least 100 samples and in this plot, We are showing how much we improve the C-index. C-index is a measure of survival prediction accuracy. In Figure 5, we show what happens when we try to predict survival just by using clinical variables, such as age, gender, and tumor stage - in comparison to clinical variables + latent factors . As you can see, in many cancers, when using latent factors, we push this accuracy metric to a higher level.
Conclusion
As sequencing prices drop, the data needed to build and run our models are getting easier to generate. In the near future, liquid biopsies and biopsies will be routinely assayed by multi-omics methods. Integrating and making sense of such datasets is the key to improve drug development and diagnostic processes. Our Arcas platform provides actionable insights from multi-omics datasets from tumor biopsies or disease models.